Chapter 5 Results
5.1 Geographical Insights
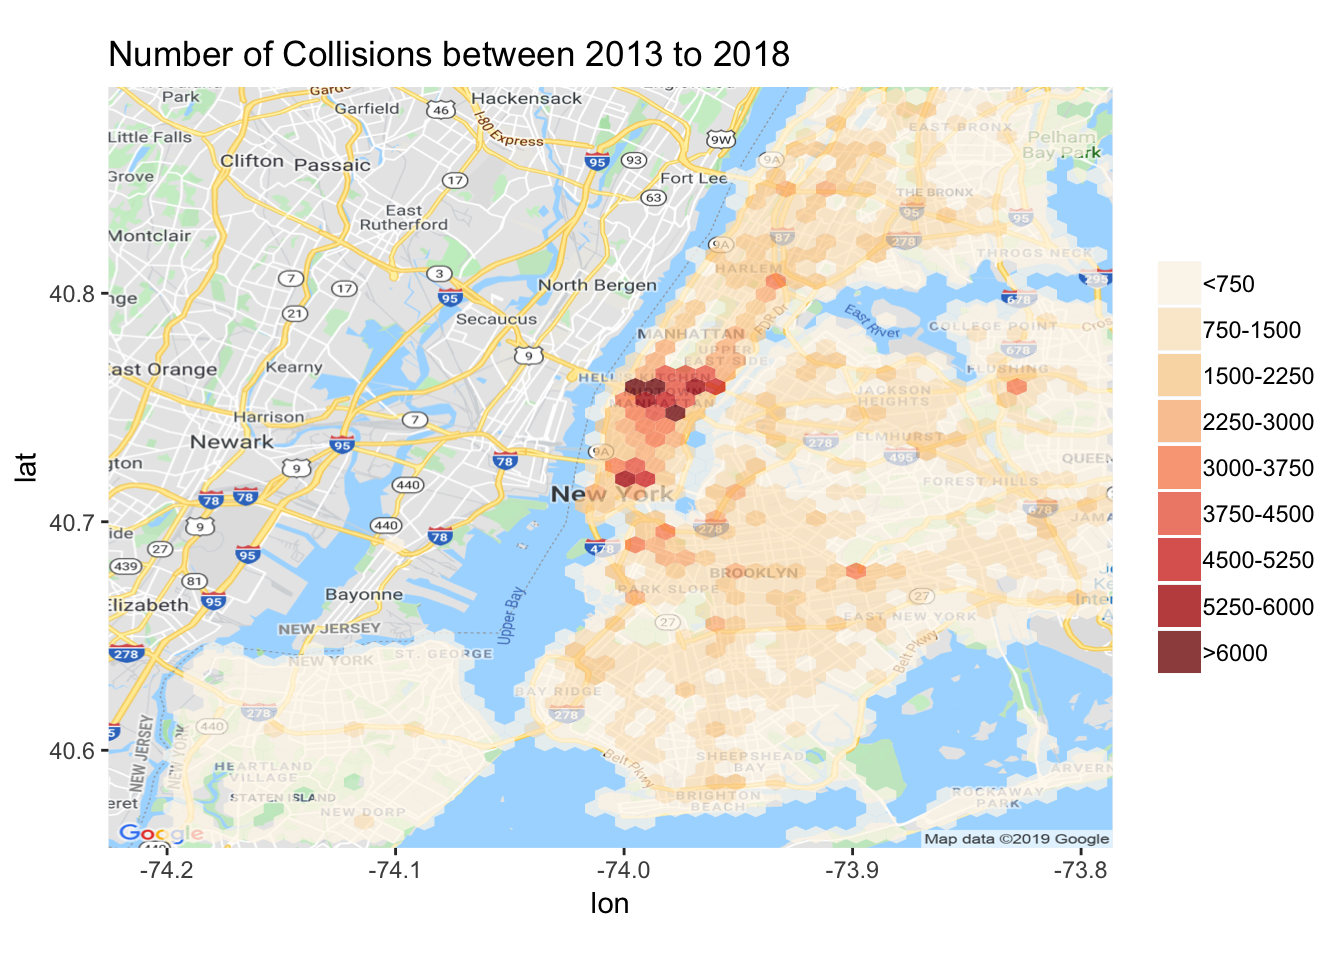
We will first show couple hexagon heatmaps of New York City Collisions between 2013/01/01 to 2018/12/31. Note we choose this time frame because we want to capture the entire year data to avoid possible seasonal impact.
5.1.1 Number of Collisions
We can see that from the below hexagon heatmap, the majority of the collisions happened at Midtown region. This is expected as Midtown area tend to have the highest traffic volume.
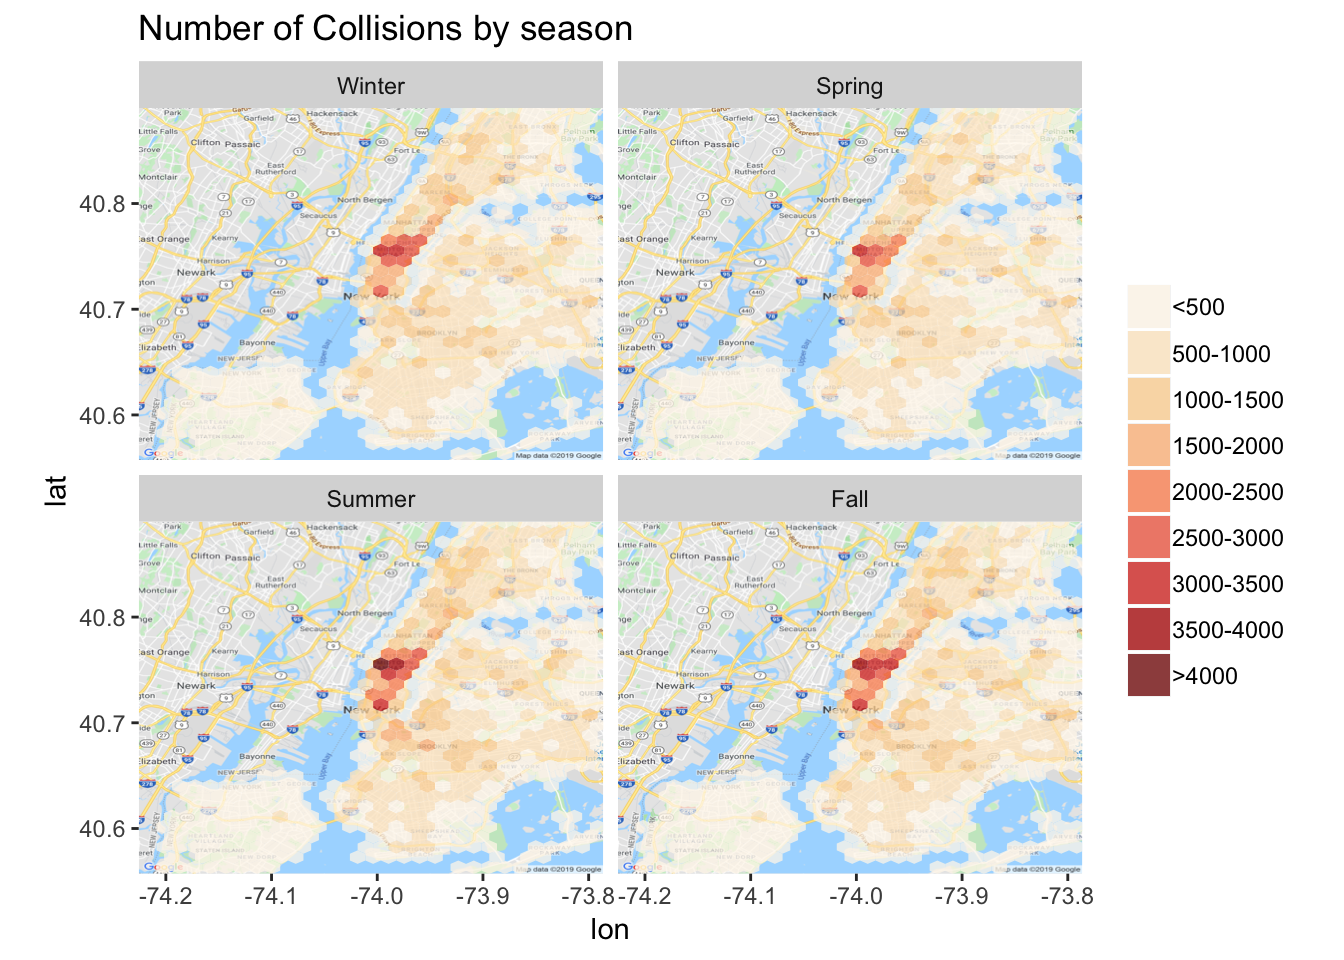
Then we want to see whether the above pattern remains if we take in the account of seasonal factor. In other words, does Midtown always has the highest number of collisions throughout the year? Thus, we assign season value for each collision based on its date and replot the hexagon heatmap facet by season (Winter: December to February, Spring: March to May, Summer: June to August, Fall: September to November). Yet, as we can see from below result, the pattern is the same among all the seasons, which Midtown has the highest collision count. However, we can observe that Summer has the overall highest collision count among all seasons.
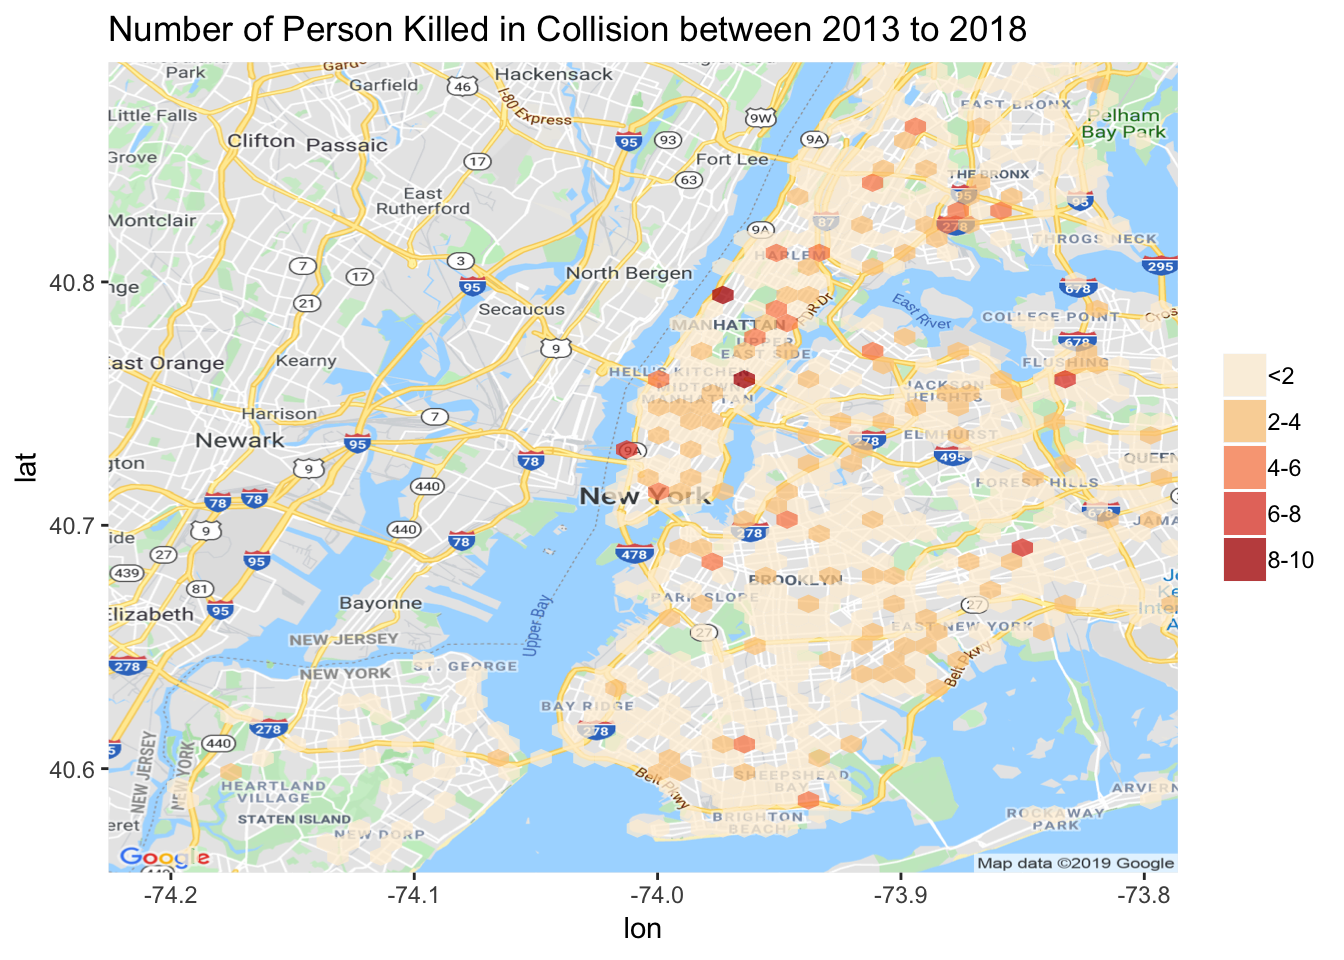
5.1.2 Number of Deaths and Injuries
Now Let’s look at the hexagon heatmap over the number of deaths from collisions. We can see that there is no clear cluster of death in geographical basis.
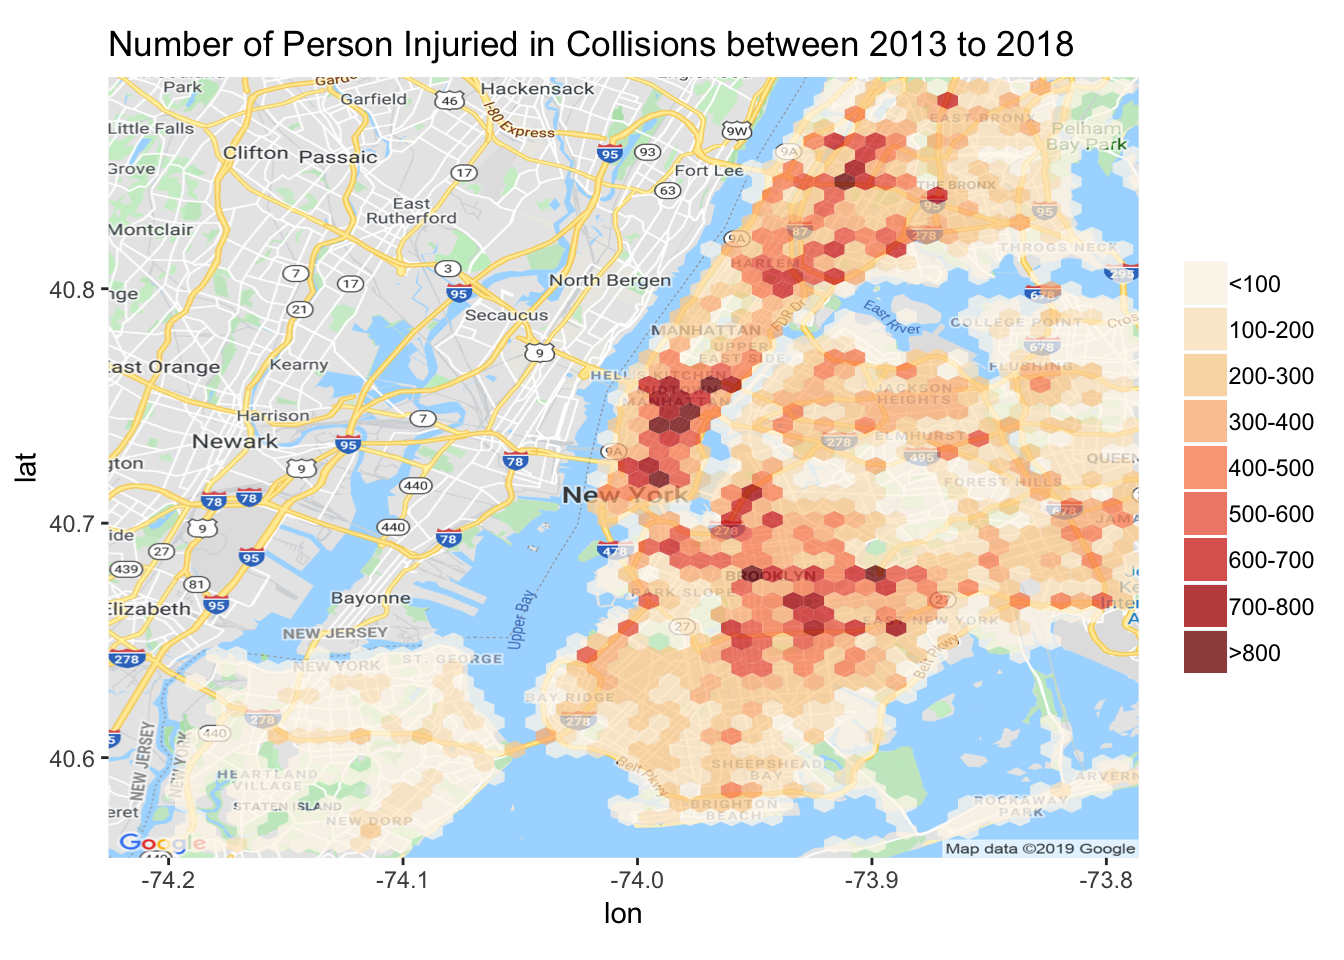
Let’s also look at the hexagon heatmap over the number of injuries from collisions. We can see that there are three major clusters that have high number of injuries. The clusters are around at Midtown, West Bronx, and Crown Heights.
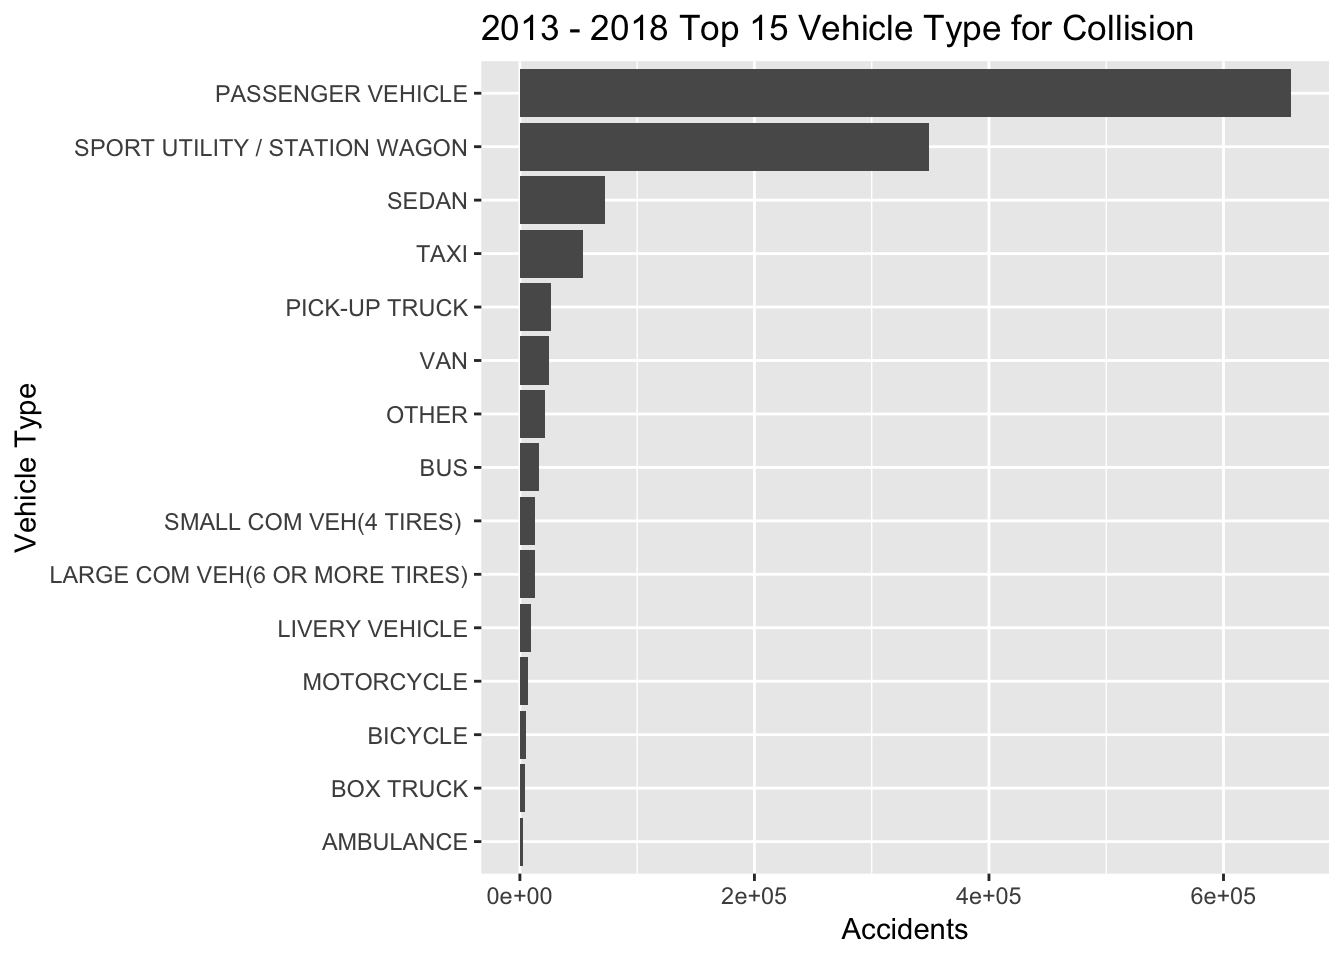
5.1.3 Vehicle Type
From below chart, we can see that passenger vehicle has the highest collisions count follow by sport utility/station wagon then sedan.
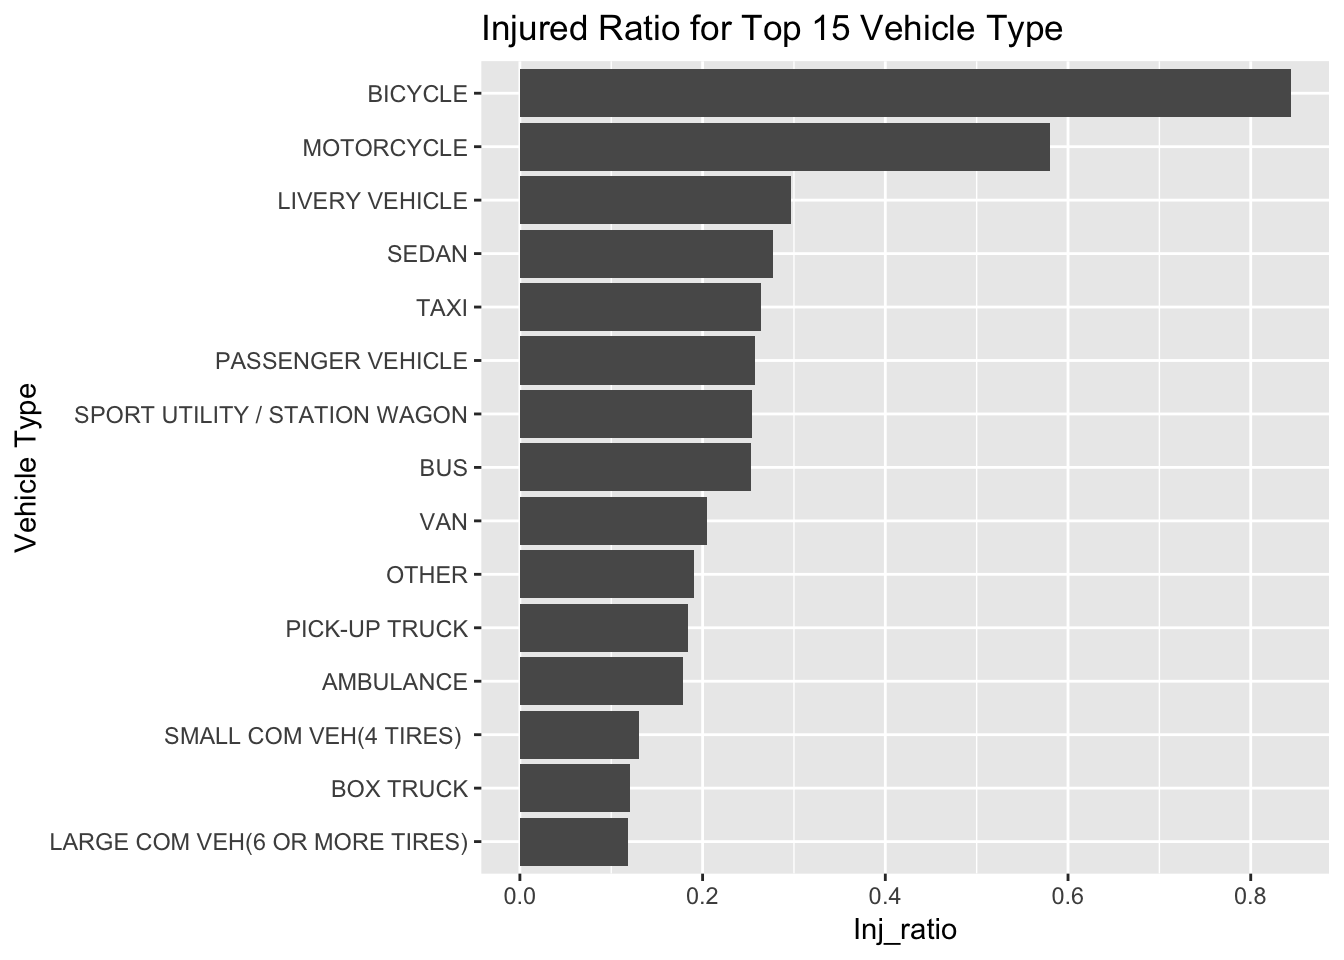
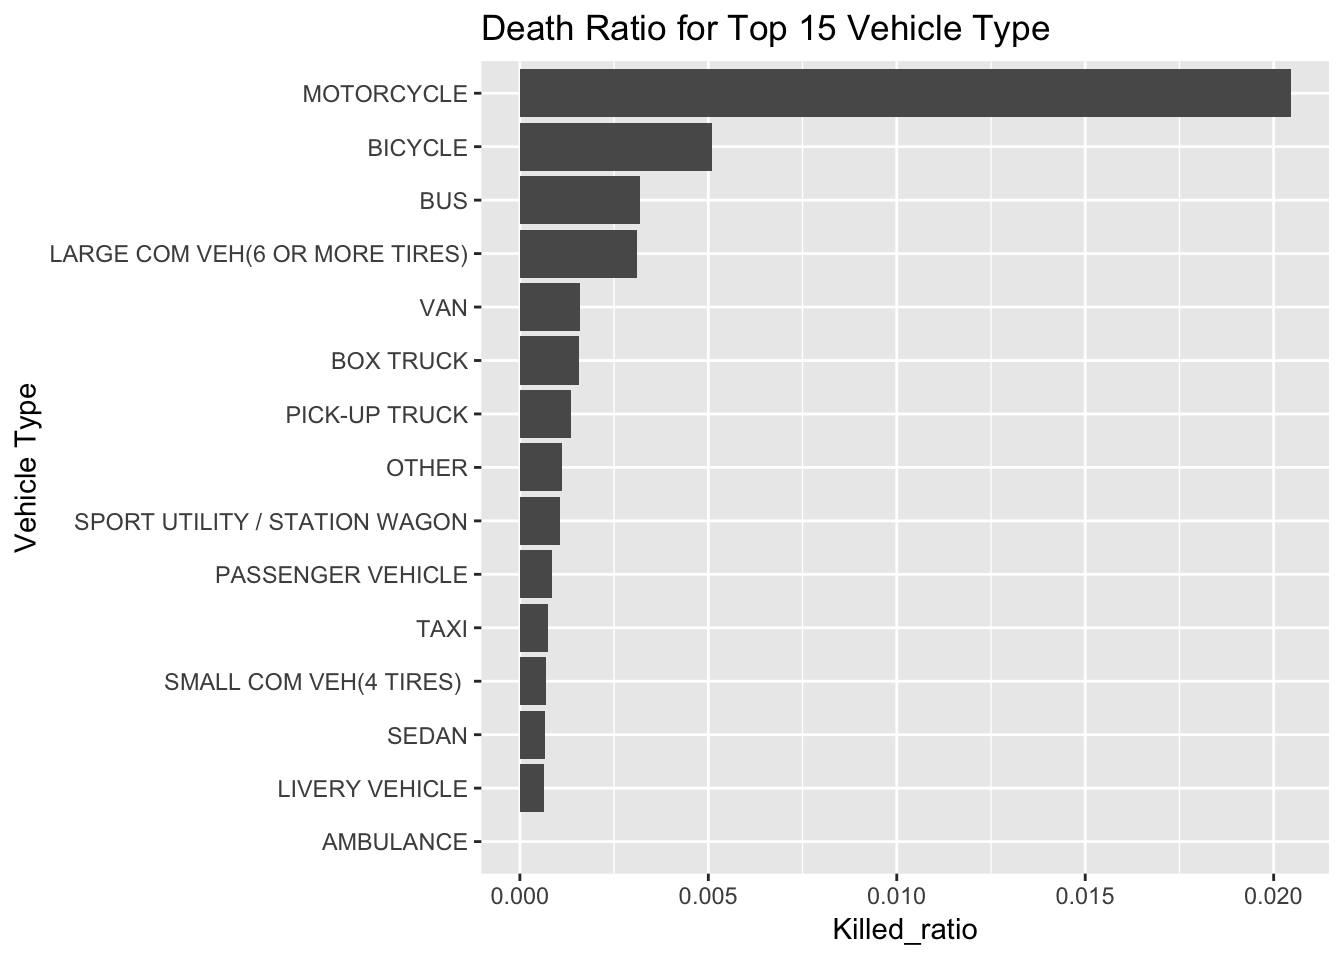
However, as we look at the death ratio and injured ratio, bicycle and motorcycle have the highest ratio. This result tells us that when a collision happens that the bicyclist and motorcyclist have a higher chance of death and injury. Thus, a bicyclist and motorcyclist should really pay attention when riding to avoid collisions.
5.2 Number of Collisions per Day
We start by having a quick look at the number of daily collisions in NYC every year from 2013 to 2018. From the time series plot above, we initially conclude that although the number of daily collisions consistently fluctuates, the average number of daily collisions is visually consistent, while gradually increasing year by year.
5.3 Number of Collisions per Month
To further decode the underlying pattern of collisions in NYC, we down-sampled the dataset by grouping daily data into monthly data. The graph prematurely confirms our initial conclusions from the previous plot by showing a consistent growth of collisions each year, while maintaining the seasonal pattern, such as peaks during the summers and drops during the winters. The pattern is so uniform that we have decided to take one more step to have a clearer year-by-year comparison.
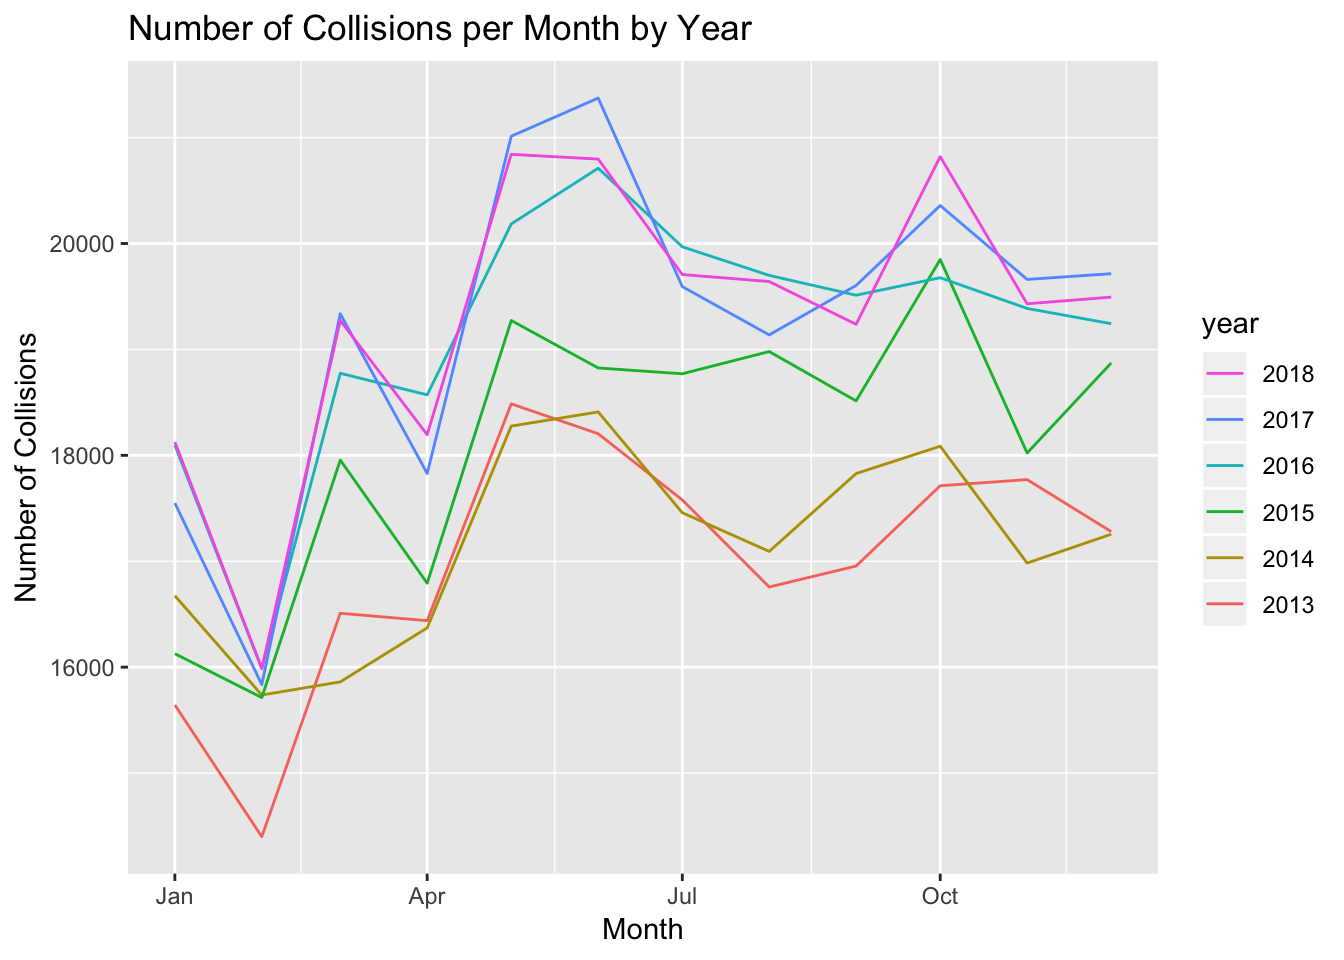
5.4 Number of Collisions per Month by Year
The resulted graph further confirms our hypothesis that although the number of collisions consistently increases every year, the uniform seasonal pattern behind the number of collisions in NYC not only gets preserved but also gets strengthened year by year, proving that there is a correlation between seasons and number of collisions.
5.5 Bar Chart of contribution factor
To provide useful advice for people to stay safer during summer times, we start tackling the high volume of summer collisions by examining the top 15 contribution factors first.
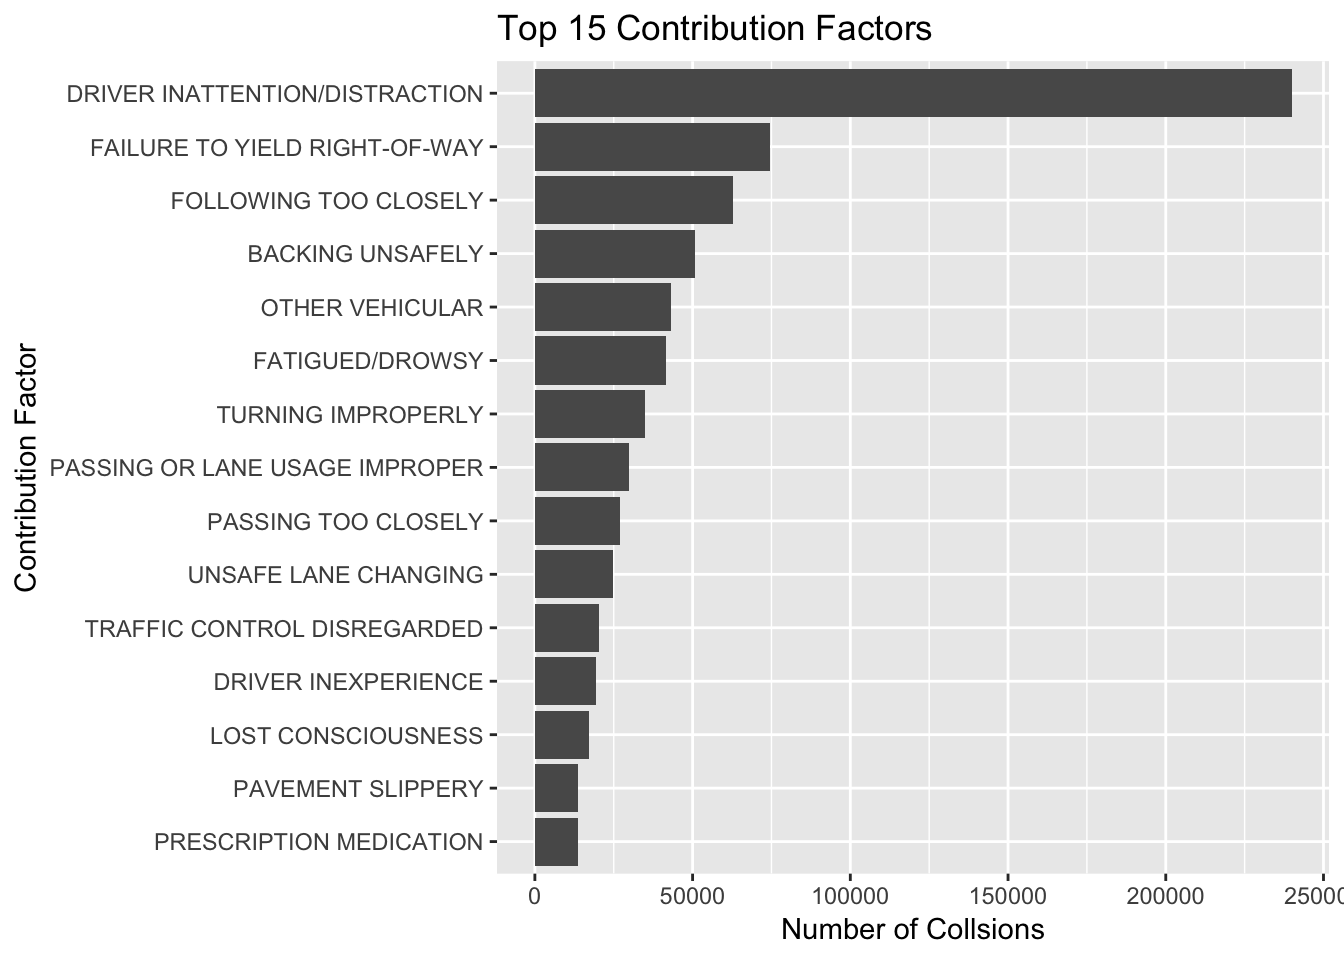
According to the horizontal bar chart above, driver inattention/distraction is the dominant number 1 contribution factor of collisions. This result prematurely echoes with the complexity and NYC traffic system, where one second of distraction or inattention could cause severe consequences.
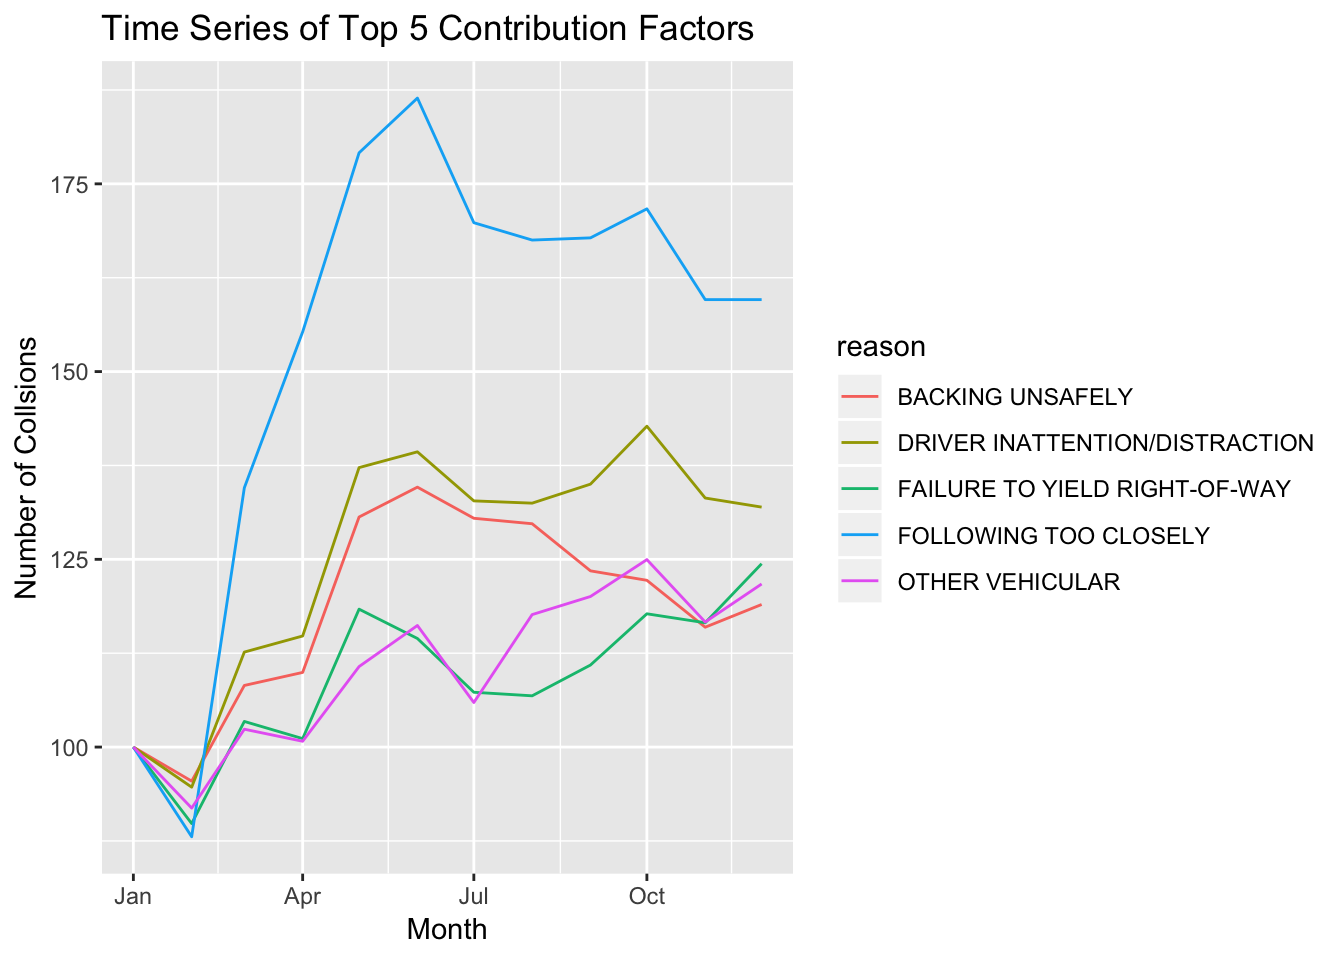
To further decode the potential relationship between contribution factors and seasonality, we create the above time series, where each line represents the percentage of change during different times of the year.
According to the results above, we can see that, although distraction and inattention are the number 1 contributing factor for collisions in general, the number of collisions caused by following too closely significantly increases during summer times, while the others stay approximately the same.
Although one could argue that the causes of a large number of summer collisions are complicated and cannot simply be answered by “seasonality”, as of now, the best conclusion we can draw from this dataset is that, given a large number of summer collisions, a good way to stay safer is to NOT follow too closely.
5.6 Correlation analysis
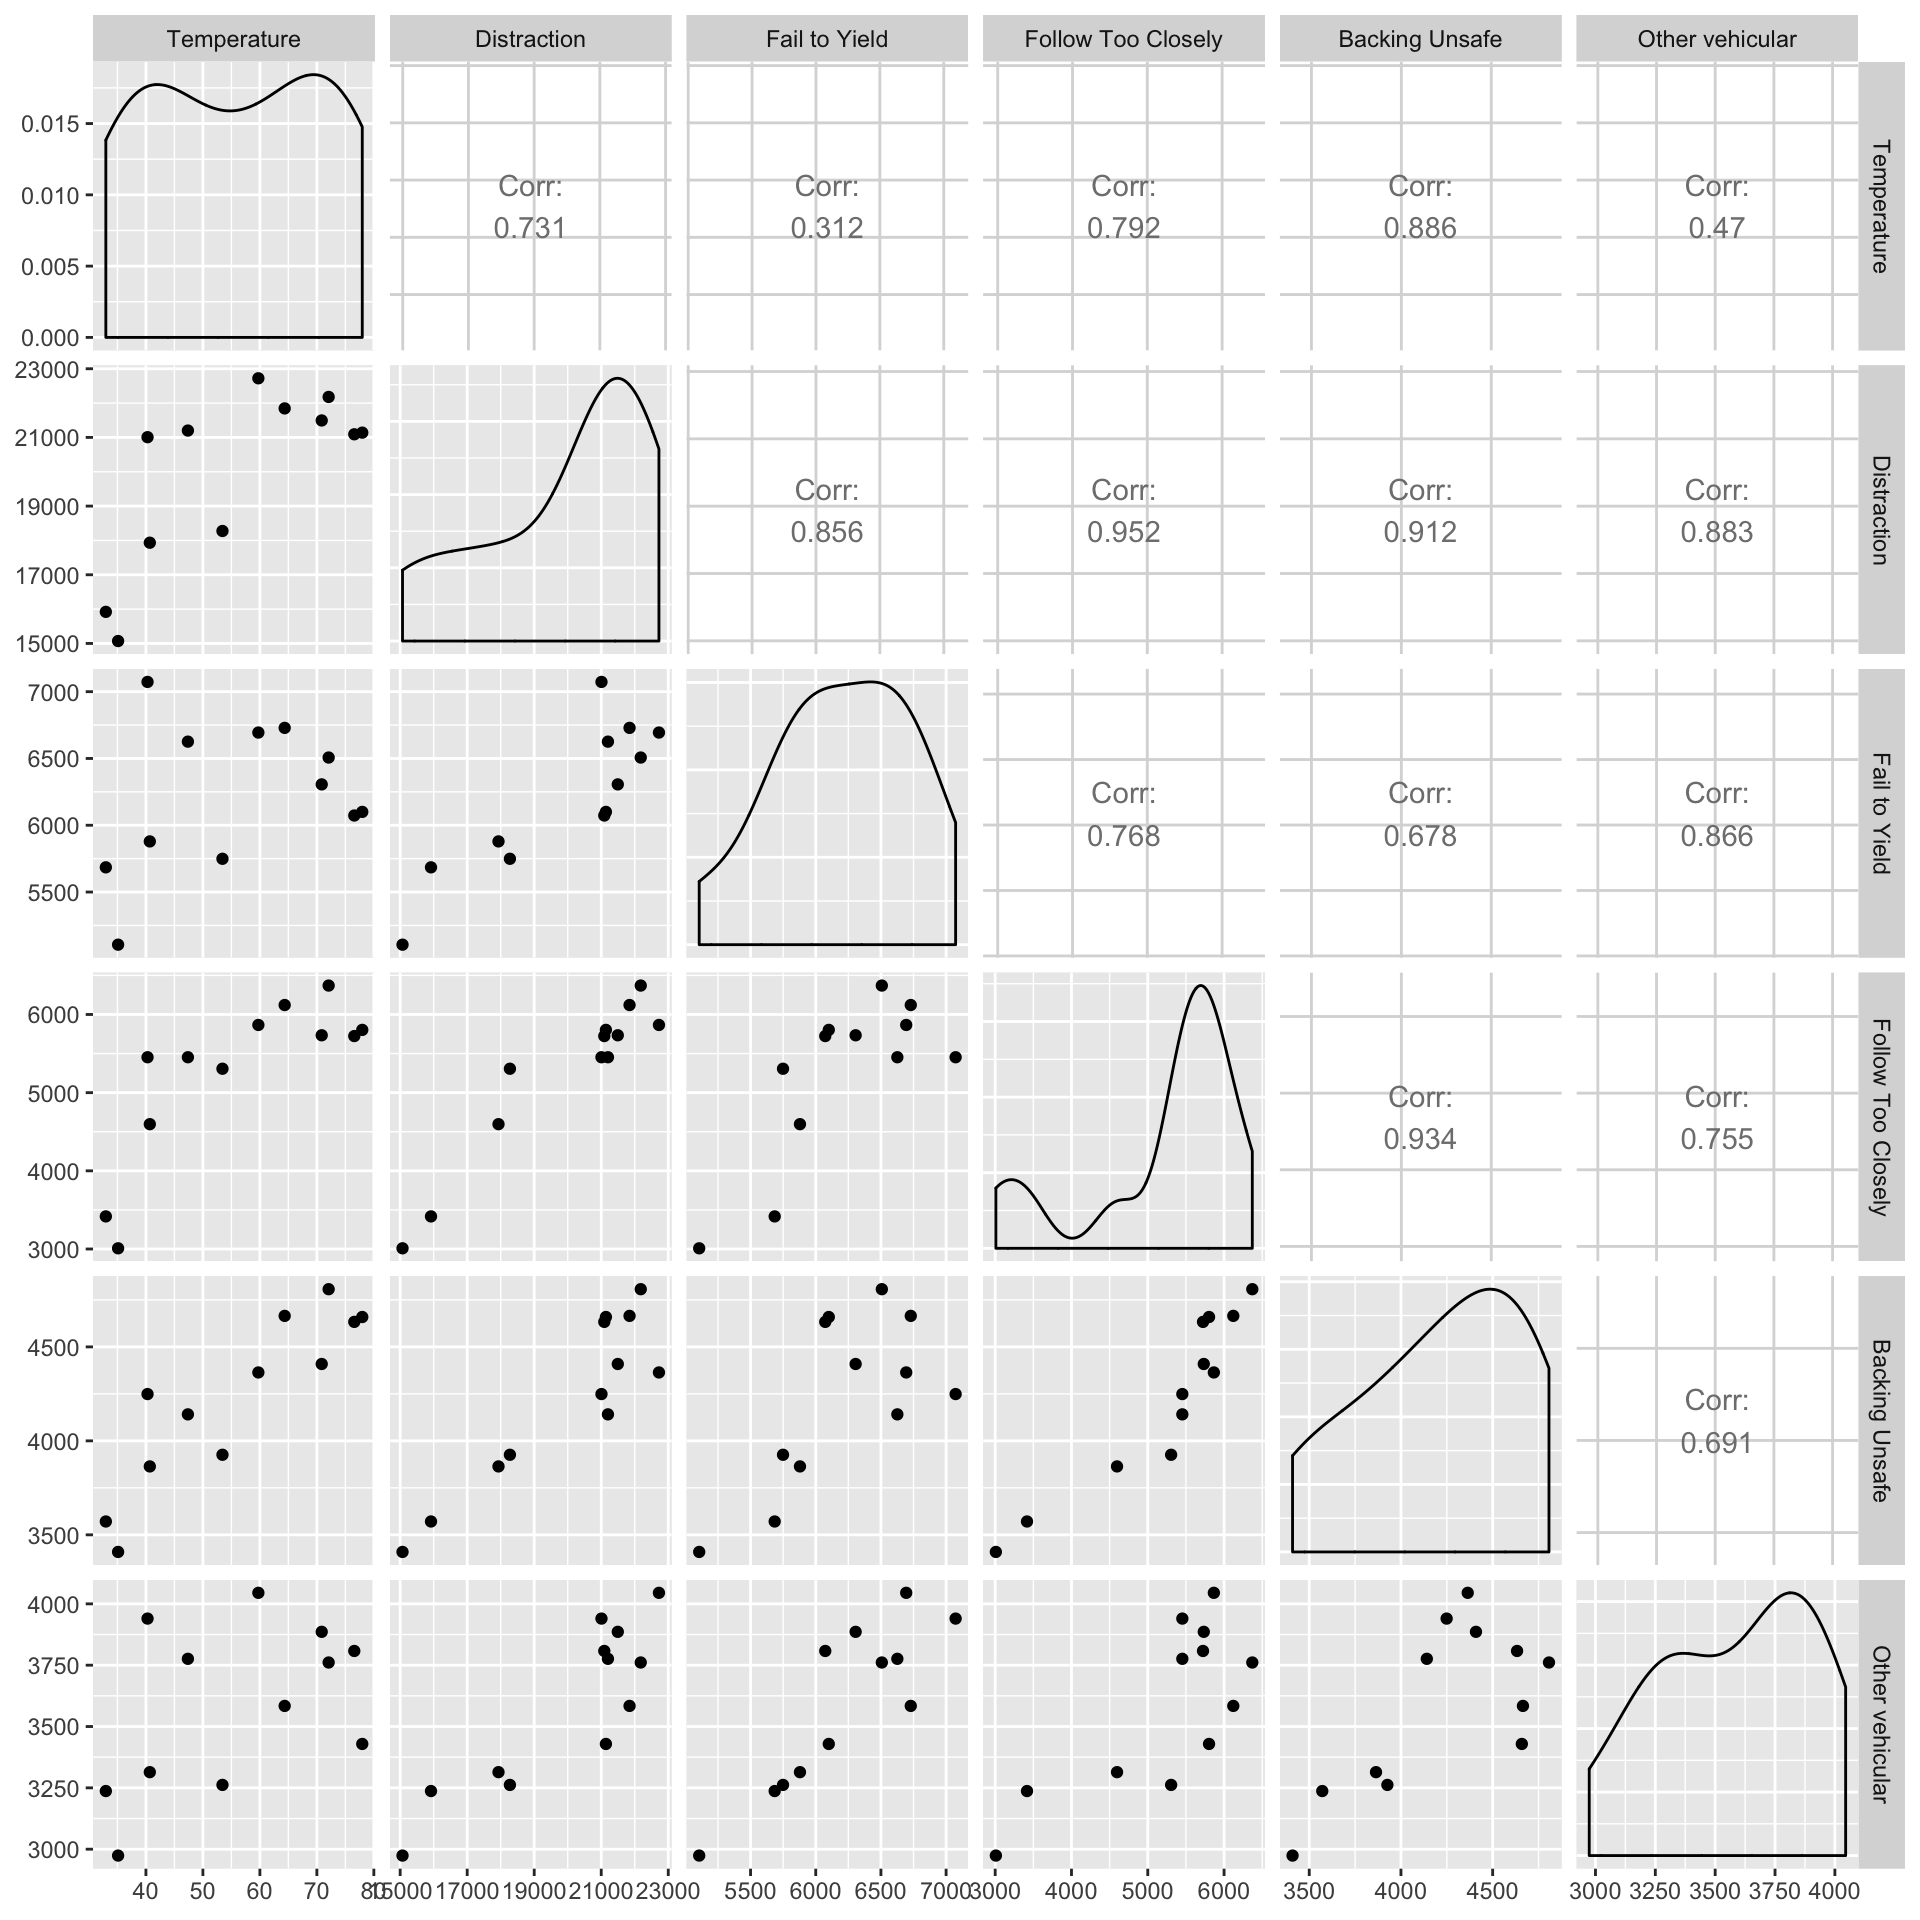
According to online research results, the causes of a large number of summer collisions could be divided into 1. More kids are out of school; 2. High heat leads to higher equipment failure rate; 3. There tends to be more roadway construction in the summer. Although we can’t possibly make definitive conclusions regarding these three points from our dataset, we use the following correlation analysis to draw some initial findings on the correlation of heat, a unique feature of NYC summers, and collisions caused by various contributing factors.
According to the results, high heat is strongly positively correlated to the number of collisions caused by distraction, following too closely and backing unsafely. Although premature, these findings could still shed new light on ways to stay safer from collisions during the summertime.
correlation analysis
5.7 Rush Hour
At this step, we have identified the correlation between seasonality and contribution factors of collisions. Conclusions drawn from previous analysis make us wonder whether there are times in a day, such as rush hours, that are more prone to collisions than the others.
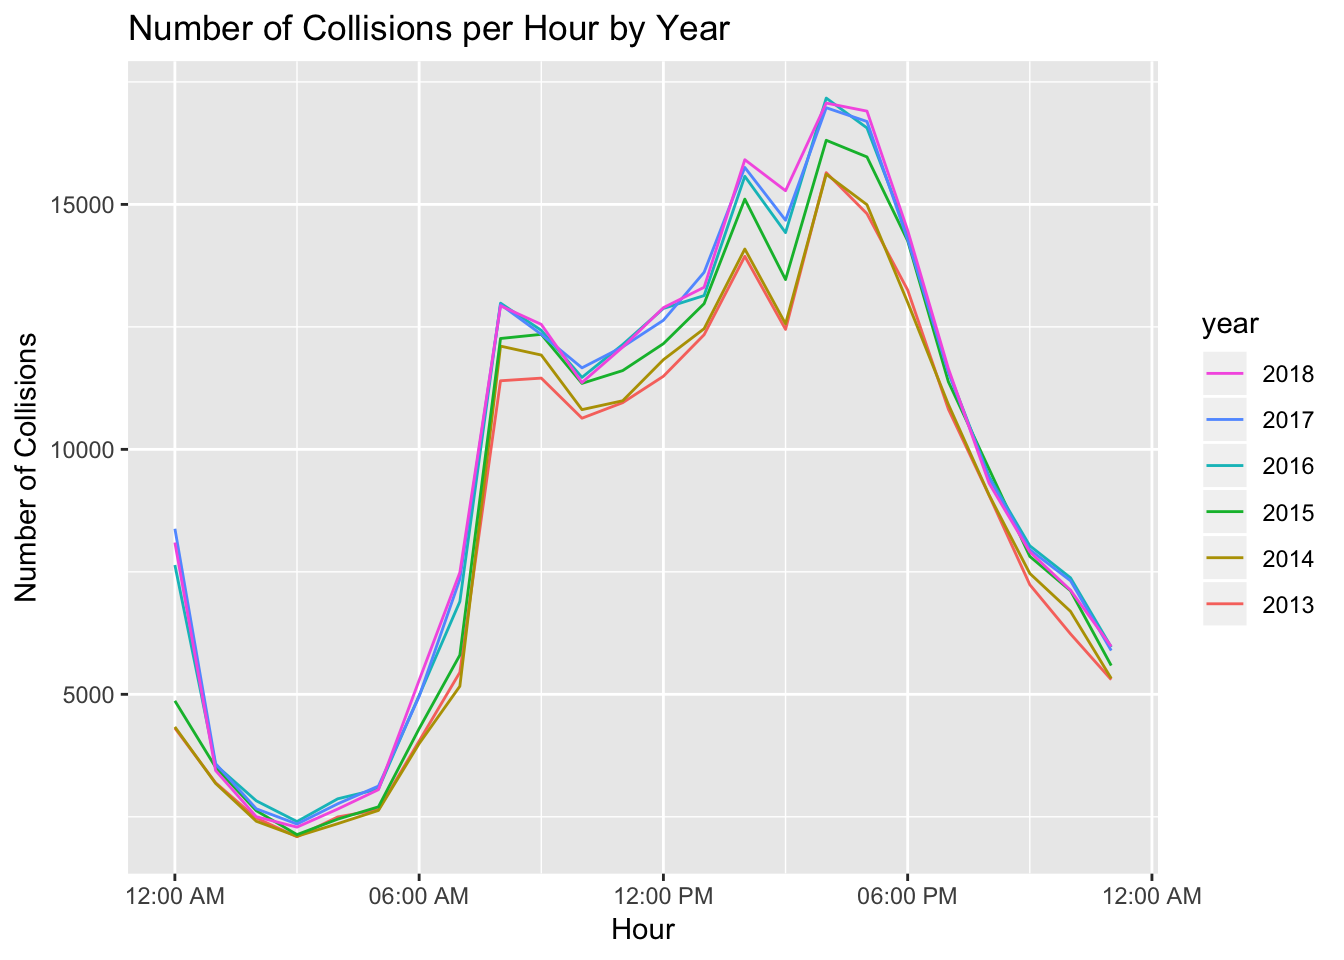
In the line plot above, we construct a direct year-on-year comparison showing the number of collisions by different time of a day. The results show strikingly uniform patterns, such that, regardless of what year, number of collisions uniformly spike during rush hours (8am and 5pm).
In order to derive more actionable insights, we started by looking at proportion of collisions caused by distraction, by different time of the year. And we notice that these two plots are almost identical in trends, both spiking during rush hours and fading after leaving for work.
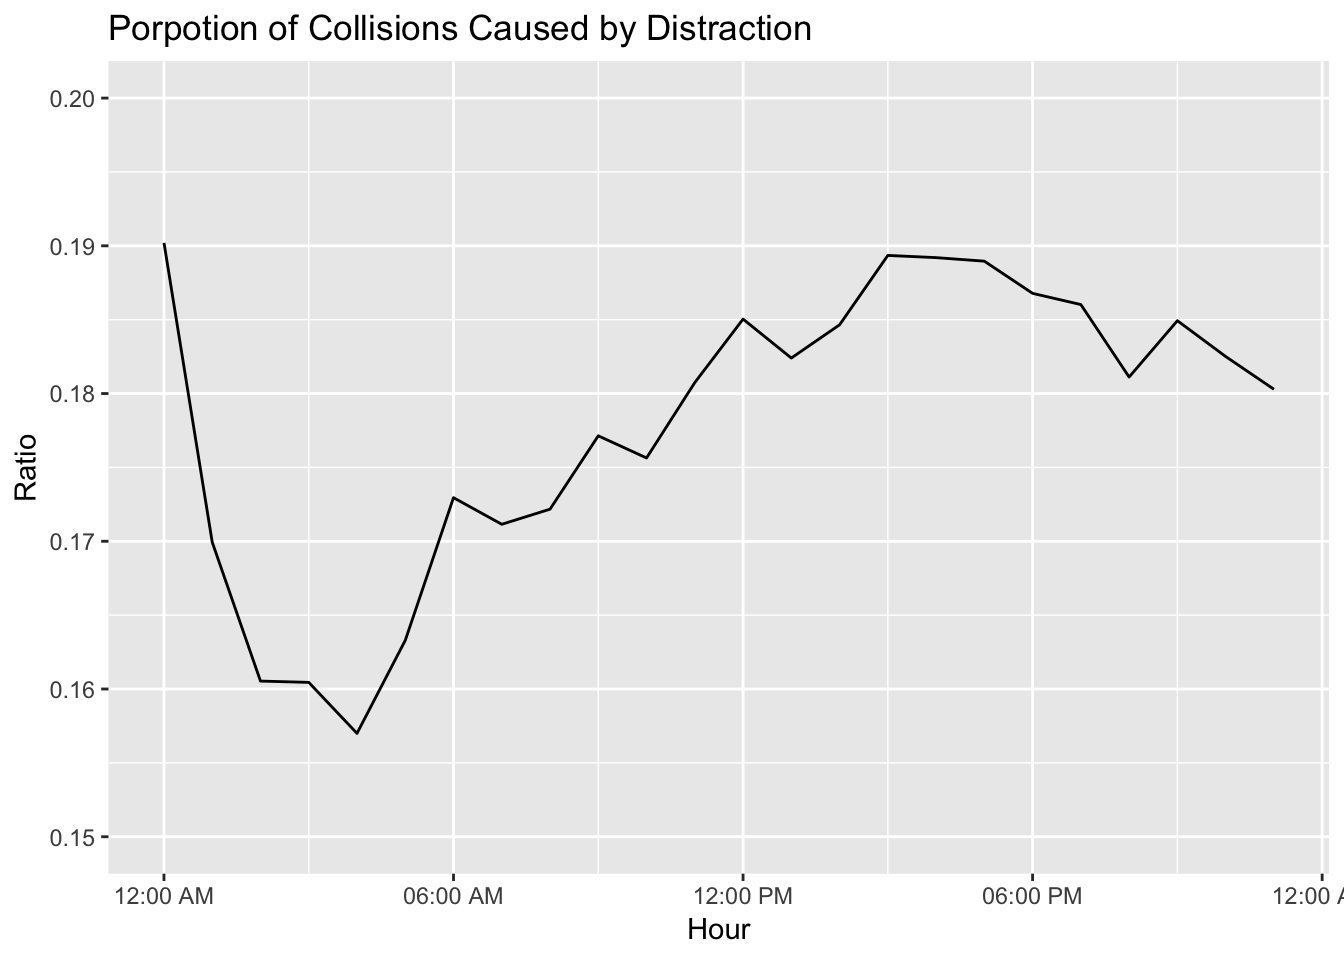
More importantly, after a long day of work, people tend to be more prone to be distracted on their way home and on their way to work.
Therefore, we conclude that, during rush hours, there tends to be more collisions, possibly due to higher traffic volume, and, more importantly, during rush hours, people are more likely to get distracted while driving.
To sum up, we strongly recommend drivers to stay more vigilant during rush hours, especially on their way home.
5.8 Precipitation
At this point, we have drawn more conclusions regarding the correlation between number of collision, and distraction, by bringing more variables into the equation. However, we haven’t discussed what exactly causes distraction, the number 1 contributing factor for NYC collisions? Are tired people simply more likely to be distracted, or is there an external factor making drivers more likely to be distracted.
However, due to the limited data source, we could only try to answer this question by analyzing how whether, especially rain, could increase the possibility of getting distracted.
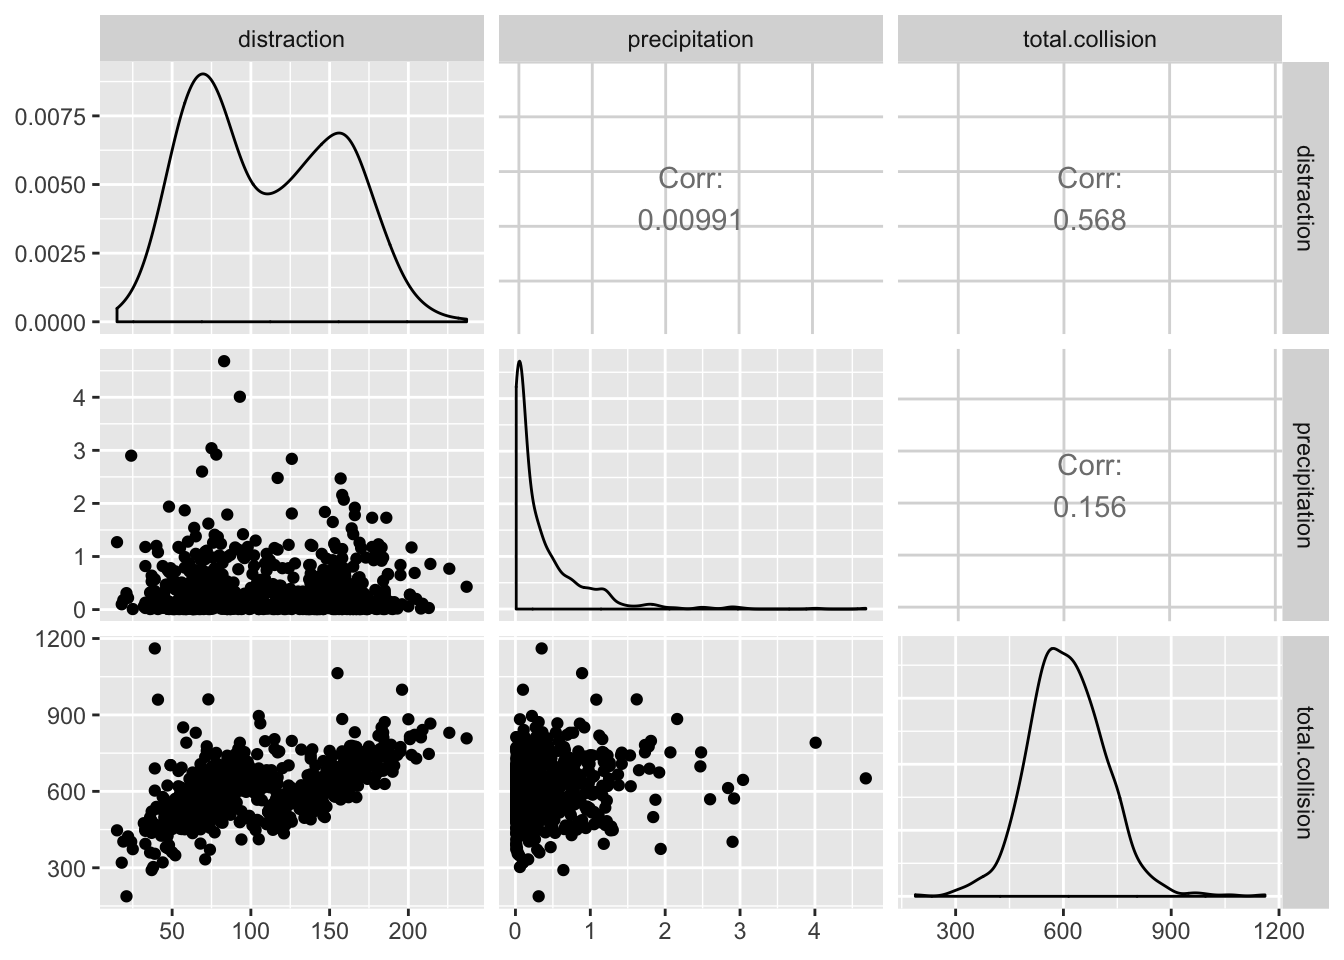
Unfortunately, according to the correlation matrix above, we don’t identify any significant correlation between precipitation and number of collisions, and between precipitation and number of collisions caused by distraction.
Therefore, a wiser advice at this point is that people shouldn’t blame rain for distraction, and it is the drivers themselves that are causing those collisions.